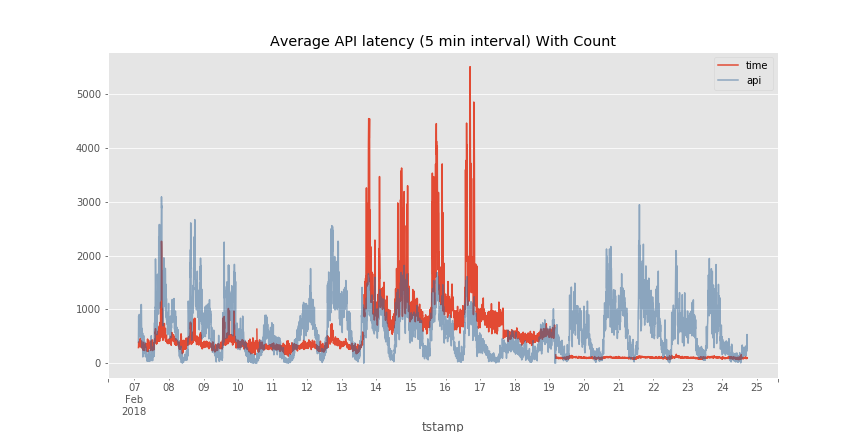
The graph pretty much tells the story. Things are much better after upgrading to a server with two more CPUs! You can see that the latencies are below their old levels starting on the 19th.
This afternoon I dusted off my old Bank Teller simulation that I use in Data Structures class and set it up to approximate the API calls and latencies that I was experiencing. Sure enough a 30% drop in performance makes a much bigger difference than you would think!
Here are the results, which I think pretty well match my experience. I control the amount of time to handle a request by randomly selecting a number within a given range. In my case the baseline range was 2 -- 10 time units. I seeded my random number generator so I'm getting the same sequence of random numbers each time I run this.
With 4 "CPU's" and baseline times to handle each request:
→ ~/D/C/C/python:git(prep)$ python graphBank.py
Processed  120  customers.
Average Time =  9.03333333333
Average Wait Time =  3.06666666667
Customers in Queue at end: 3
If I increase the low end of the range to 3 and the top to 13 (roughly 30% on each end) I see this:
→ ~/D/C/C/python:git(prep)$ python graphBank.py
Processed  101  customers.
Average Time =  28.3168316832
Average Wait Time =  20.2772277228
Customers in Queue at end: 22
Wow, thats a lot more than I would naively expect. I definitely need to go re-read a queuing theory chapter. Keeping the range at 3 -- 13, but increasing the number of CPU's from 4 to 6 I get this:
→ ~/D/C/C/python:git(prep)$ python graphBank.py
Processed  120  customers.
Average Time =  9.60833333333
Average Wait Time =  1.59166666667
Customers in Queue at end: 1
I need to clean up the code before I'm willing to publish it here. But if you are really interested contact me and I'll be happy to share it as is.
Comments
comments powered by Disqus